Following on from the presentation of the “preliminary catalog of recorded EIT waves” at the recent Waves Conference, which presented all recorded EIT waves spanning from the 25th of March 1997 up until the loss of contact with the satellite in June 1998, the last recording being on the 16th of June 1998, it was decided that a thorough examination was to be made of dimming events associated with this period.
It was decided that such observations should be made in a catalog, similar to previous wave catalogs, depicting a dimming per image and associated phenomena such as EIT waves, Flaring regions and CME directions.
The Dimmings to be observed with the EIT telescope on board SOHO, which has an average image cadence of 12 minutes to document the dimming and flaring regions. The LASCO coronagraph used for associated CME observations, and GOES X-RAY data for the study of the flaring regions. Later depending on observing campaigns, it is hoped that MDI and YOHKOH data will be incorporated for an even more thorough study.
Dimmings I, A Brief Description
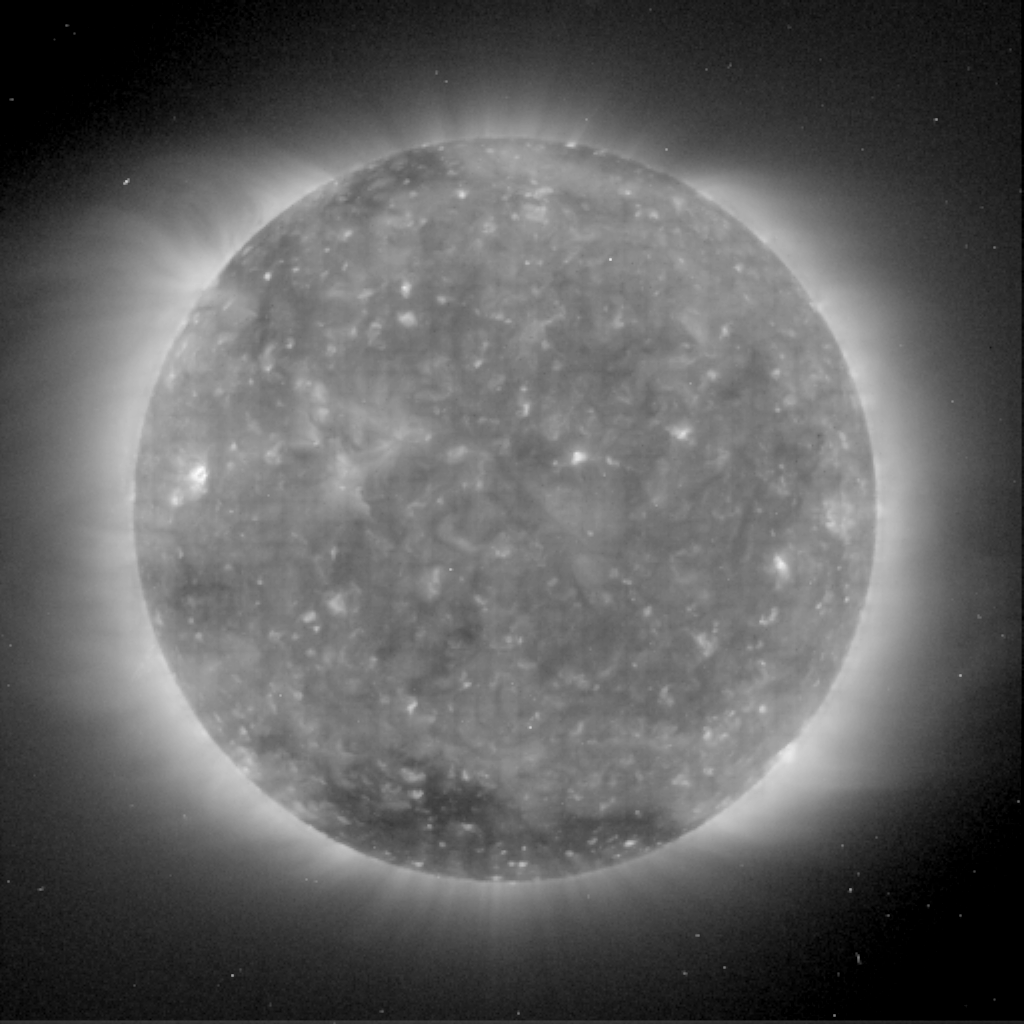
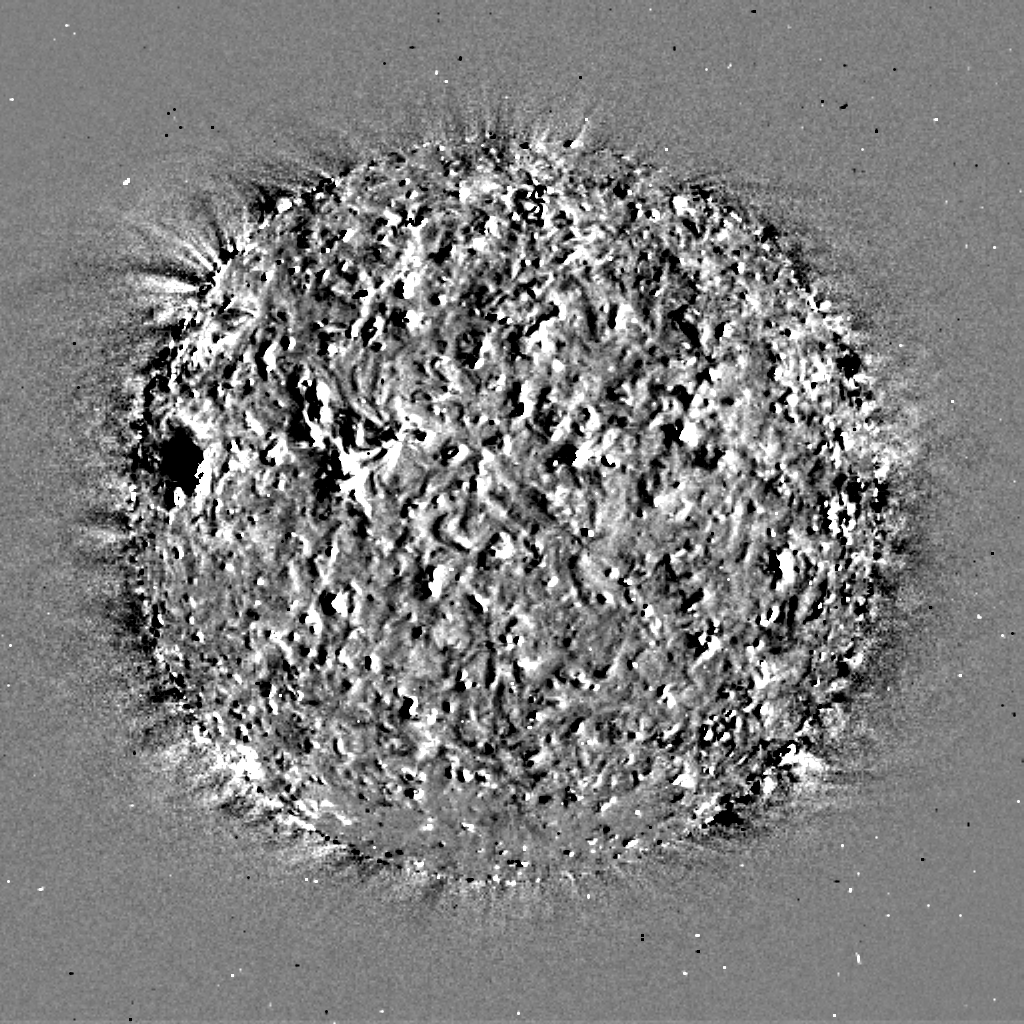
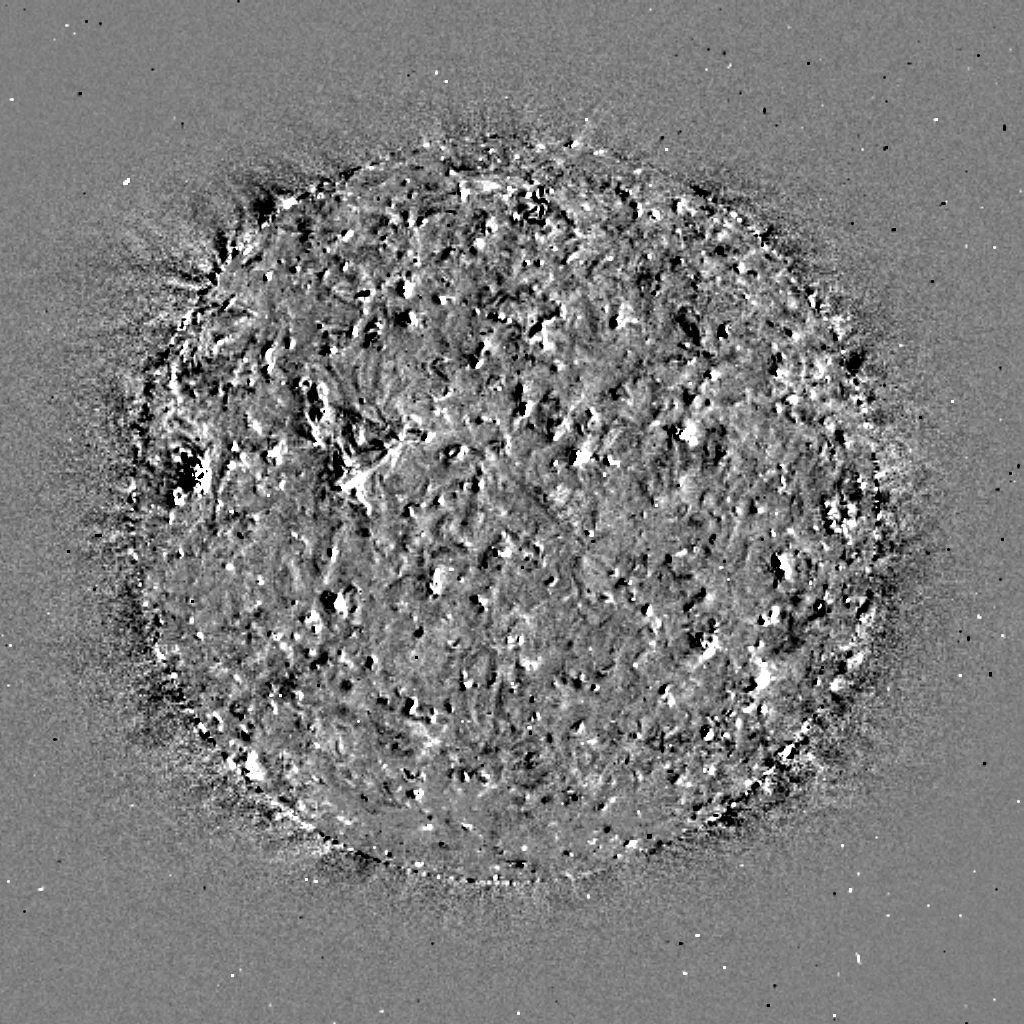
Dimmings are regions of the solar surface where emission falls to a background level, that comparable to coronal holes. These regions are often associated with flaring regions, CME's and EIT waves.
We often see a flare event which will produce an emission drop in the concavities of sigmoid like structures (B.J.Thompson et al.), this region of decreased emission is what is known as a dimming region. After a short time the region will regain it's original composure and an average solar emission again. The structures show evidence of pre-existing magnetic structures, maybe as the foot-points of a flux rope. The dimmings are associated with a decrease in coronal density.
These structures have been observed since 1983, they were first observed by Skylab and named, “transient coronal holes” (Rust et al.), but our understanding of their cause and structure is weak, there have been
associations with various phenomena including CME's, EIT waves and Flares. Few dimming catalogs have been produced and no comprehensive ones for the period 25th of March 1997 through to the 16th of June 1998.
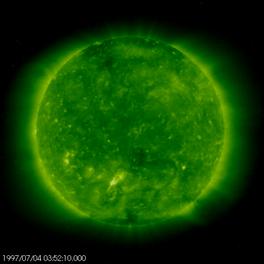
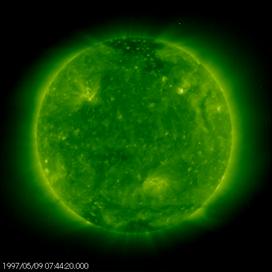
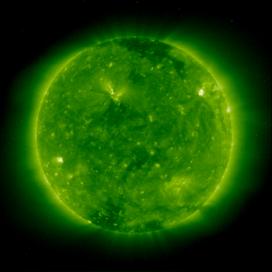
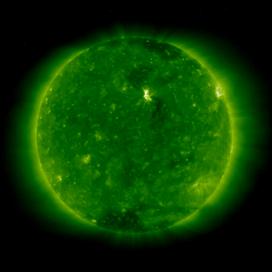
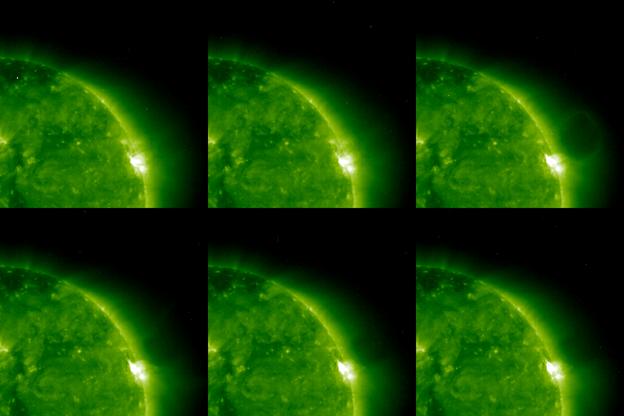
Coronal Dimmings - an Example
The Catalog
The catalog is separated into four main sections,
The first to catalog the basic dimming shape, evolution, quality and size.
The second section acts to compare relevant dimming properties to any associated wave phenomena, as the catalog is currently based around the timings of the wave catalog, there is always data for comparison, waves are also cataloged without the presence of dimmings, as understanding their absence is equally important as understanding their presence.
The third part of the catalog acts to compare dimmings to CME events.
inally we consider the comparison of the associated flare and Dimming, as the length and type of flare can have large differences.
As well as including tabulated data the catalog will use simple plots to guide the user to the type of dimming, its position and size.
The Catalog I, Dimming Characteristics
The first part of the catalog covers the basic
characteristics of the Dimming event, looking at:
Event time, date and duration for the purpose of reference.
Time of maximum size, this defining the peak of the growth.
Time of Lowest emission, this indicating the most prominent
moment of the dimming.
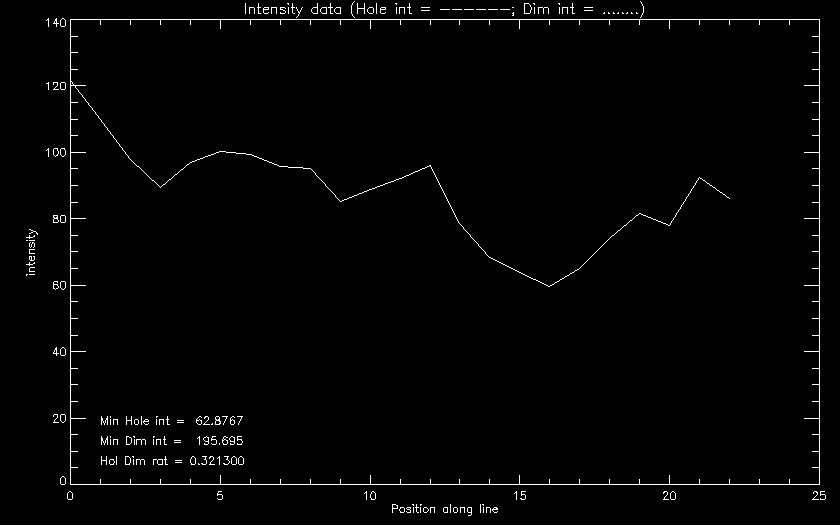
In attempt to look at the potential mass loss of one of these regions a comparison is drawn between the dimming intensity and that of local coronal hole regions, this will also be used in the categorizing of the events, a deeper intensity event being a higher quality event.
Direction of growth, this will aim to look at any common
characteristics, do the dimmings trace out the base of waves? CMEs? Or is a
North South correlation present, relating to the state of the B field in the
solar cycle?
Central position as a heliographic location, useful for comparison purposes.
Quality rating, eventually this will be based upon the intensity and the size.
Description, here a brief description of the type, quality and look of the dimming, also image quality will be noted.
The Catalog II, Wave’s with Dimmings
Wave – Dimming correlation studies have been produced in the past and correlation appears strong between these two phenomena, the dimming often seen to map the base of the wave in numerous examples. based around the wave catalog (Myers, D.C. Thompson, B.J.) this provides the basis of the initial catalog, including the following:
A comparison of wave and dimming duration.
The wave and dimming center will be compared.
Wave and dimming velocity.
Dimming and wave quality, the wave quality classification is included below.
An indication if the dimming is inside or outside the wave.
The wave and dimming amplitude.
A shape comparison through a brief description.
| Rating | Description | Confidence Level (%) |
| Q0 | Not likely to be a wave / poor data coverage | <10 |
| Q1 | Faint appearance, still unclear | <25 |
| Q2 | Propagation of brightened front | >25 |
| Q3 | Propagation of brightened front | >50 |
| Q4 | Almost definitely | >75 |
| Q5 | Clear propagation of front | 100 |
The Catalog III, CME’s with Dimmings
It has often been surmised that dimmings are the ground tracks of CMEs (Thompson, B.J. 2000), in certain cases giving better spatial correlation than the associated flaring region, see figure 3. As the third part
of the catalog CMEs and dimmings are brought together, the following characteristics are cataloged:
Dimming duration.
Dimming projection angle.
CME center angle.
CME speed.
Dimming speed.
CME width.
Dimming shape.
And a brief shape comparison.
The Catalog IV, Flare’s with Dimmings
The fourth part comprises of a catalog of features surrounding
the dimming and the related active region. Flares are not always seen with
waves and dimmings for reasons unknown, and the strength of such waves and
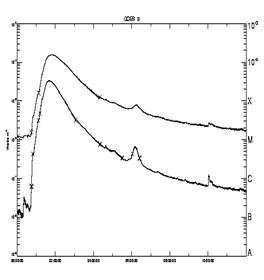
dimmings is often provided by the size of the associated flare. To the right in
figure 4 the 4th July 1997 event, is shown with associated GOES
plot, indicating the flare strength. The catalog will look to include:
Post-flare times.
Flare strengths and dimming qualities are compared.
Dimming and flare duration from the GOES perspective.
Dimming amplitude.
A log of the number of dimmings associated with a multi-flaring
site.
Finally a comparison of the flare profile and corresponding
dimming shape.
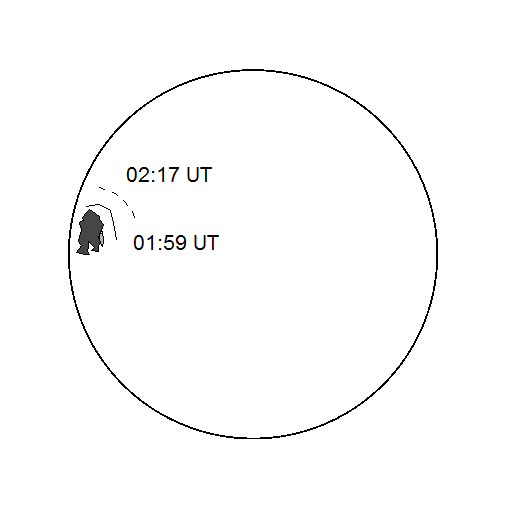
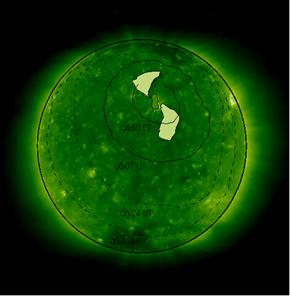
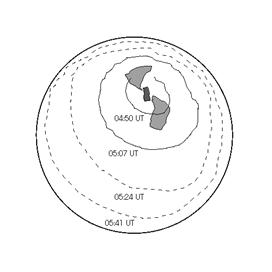
The Catalog V, Dimming diagrams
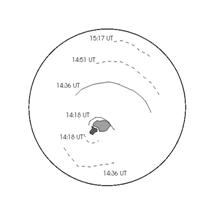
The Dimming/wave diagrams that make up the catalog are
designed to show the growth of the dimming and wave regions.
Dark gray regions show the location of the source active region
(when applicable).
Light gray regions show the location of the dimming.
Solid black lines indicate a well derived bright front.
Dashed lines indicate where a weak front was observed.
Figure 5, Above gives an example of a dimming diagram for the 12th May event.
First Results From The Catalog I
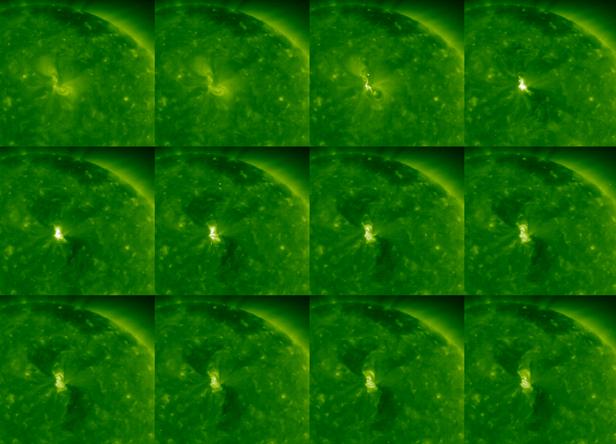
It has been suggested that a dimming corresponds to preexisting magnetic structures, included within the “Flare’s with Dimmings” catalog section, multiple faring sites are acknowledged, and from the data of multiple flaring sites it is seen that following an initial dimming structure, subsequent dimmings will follow similar paths and fill similar areas. We note the 9th , 10th and 12th of May events (see figure 6 below). If it is to be believed that mass is lost during a dimming event, perhaps the initial event indicates an opening a weakness in the field. Even though the upper dimming area is obscured in images a and b, the bottom region is seen to be of similar shape all events.
First Results From The Catalog II
A great example of the correlation between dimmings with CMEs was seen in a series of images from 29-Jun-1997 between 14:33 and 15:07, where the event is observed near the West limb, the CME is seen to erupt off the limb, and the corresponding dimming at the base maps the CME perfectly. See figure 8.
First Results From The Catalog III
Some other preliminary results have included:
A high correlation between Dimming and wave orientation, we often see dimmings at the base of waves, mapping the shape of such waves. Often CMEs are seen to map similar directions.
We often find the size of flare’s, CME’s, dimming’s and wave’s are all proportional, the sizes and statistics of such characteristics to be followed up.
The quality of a wave event will often depict the quality of a related dimming.
It has been seen through the GOES plots that, a sharp flare might be seen with a quick wave and dimming, or a long drawn out event is seen in the GOES timeline, corresponding to a “bubbling away” active region, this will often produce a less prominent wave, but an evolving dimming region showing strange shape and movement.
The Future
Where to now, through the initial observations, it has been found that other observations should be made to make the catalog more complete, so following the completion of the basic catalog, the following observations are likely to be made:
H alpha observations, dimmings were first observed in H alpha, a useful comparison, this will all depend on available data. With H alpha observing the chromosphere two useful comparisons could be made, it has been suggested by Harrison and Lyons, 2000 that dimmings vary greatly with T, we can also consider the position of the eruption in the solar surface/atmosphere, this could make the dimming more observable. Similar cases could be put forward for the other wavelength images on EIT, as these observe slightly different temperatures and therefore regions.
Current CME analysis is based upon the comprehensive CME catalog (Dr Seiji Yashiro), which documents a number of the larger events, some of the more faint events are often hidden and a thorough analysis of LASCO and EIT data needs to bed made.
Current coordinates and speeds are provided in plane of sky co-ordinates, these will have to be converted to heliocentric.
The quality rating of the dimmings is based around the intensity ratio of local coronal holes and dimmings, and the size of the dimming, as more data becomes available this rating will have more meaning, being compared to the best and worst examples of a dimming event.
References
Biesecker, D.A, et al. 2002, The Astrophysical Journal, 569:1009-1015.
Myers, D.C. Thompson, B.J. (To be published), A catalog of SOHO “EIT Wave” Transients (Preliminary Version)
Rust, D.M, et al. 1983, Space Science Reviews, 34:21-36
Thompson, B.J. et al. 1999, The Astrophysical Journal, 517:L151-L154.
Thompson, B.J. et al. 2000, Solar Physics, 193:161-180.
Thompson, B.J. et al. 2000,Geophysical Research Letters, Vol 2, No.10,1431-1434.